DISQOVER
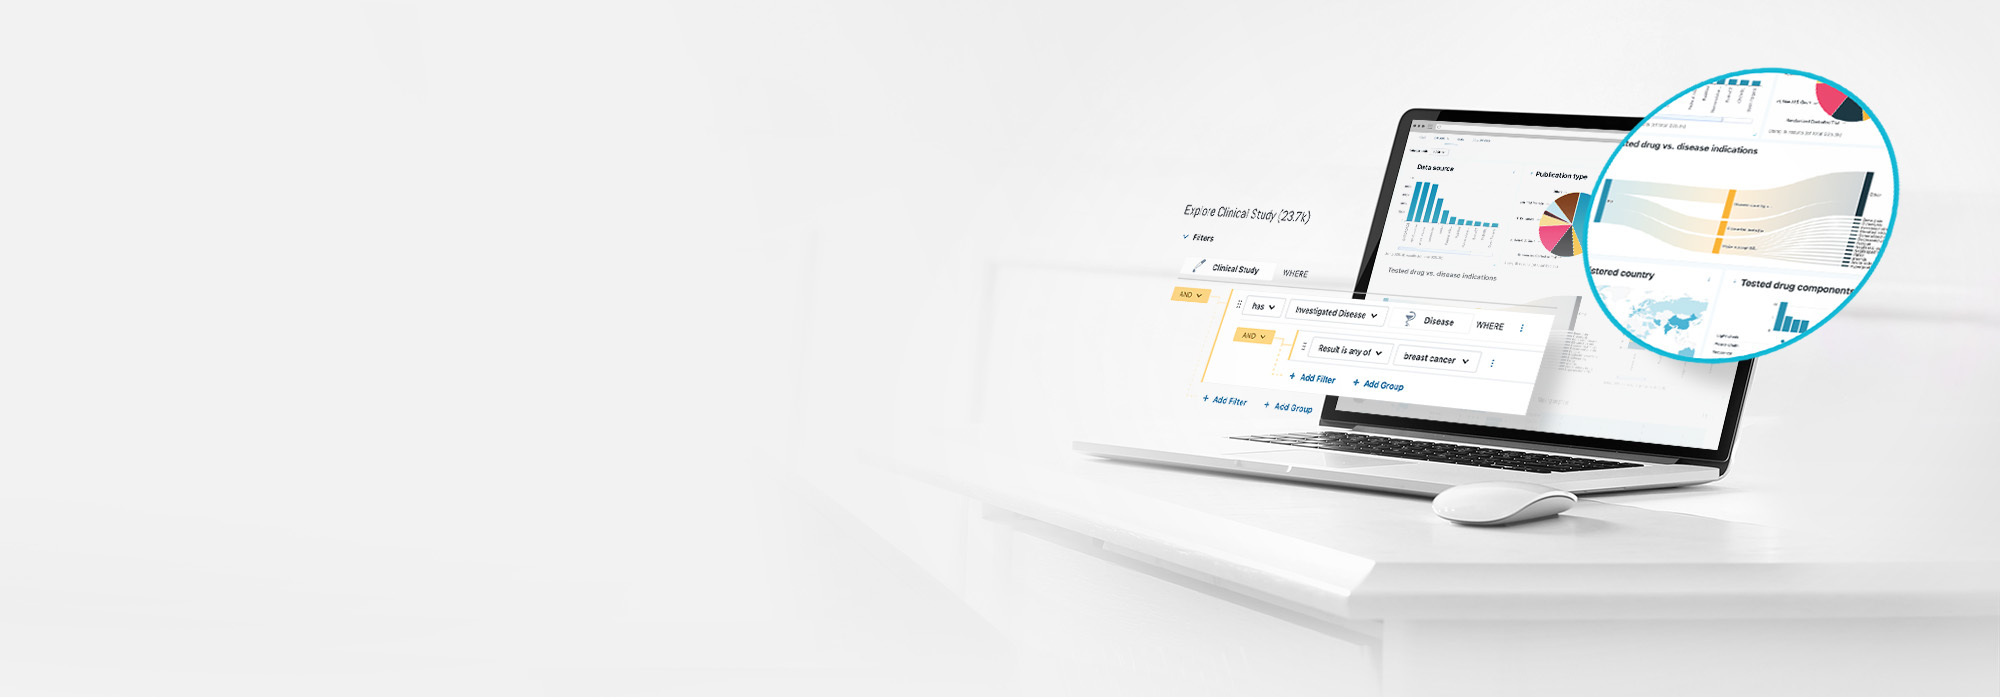
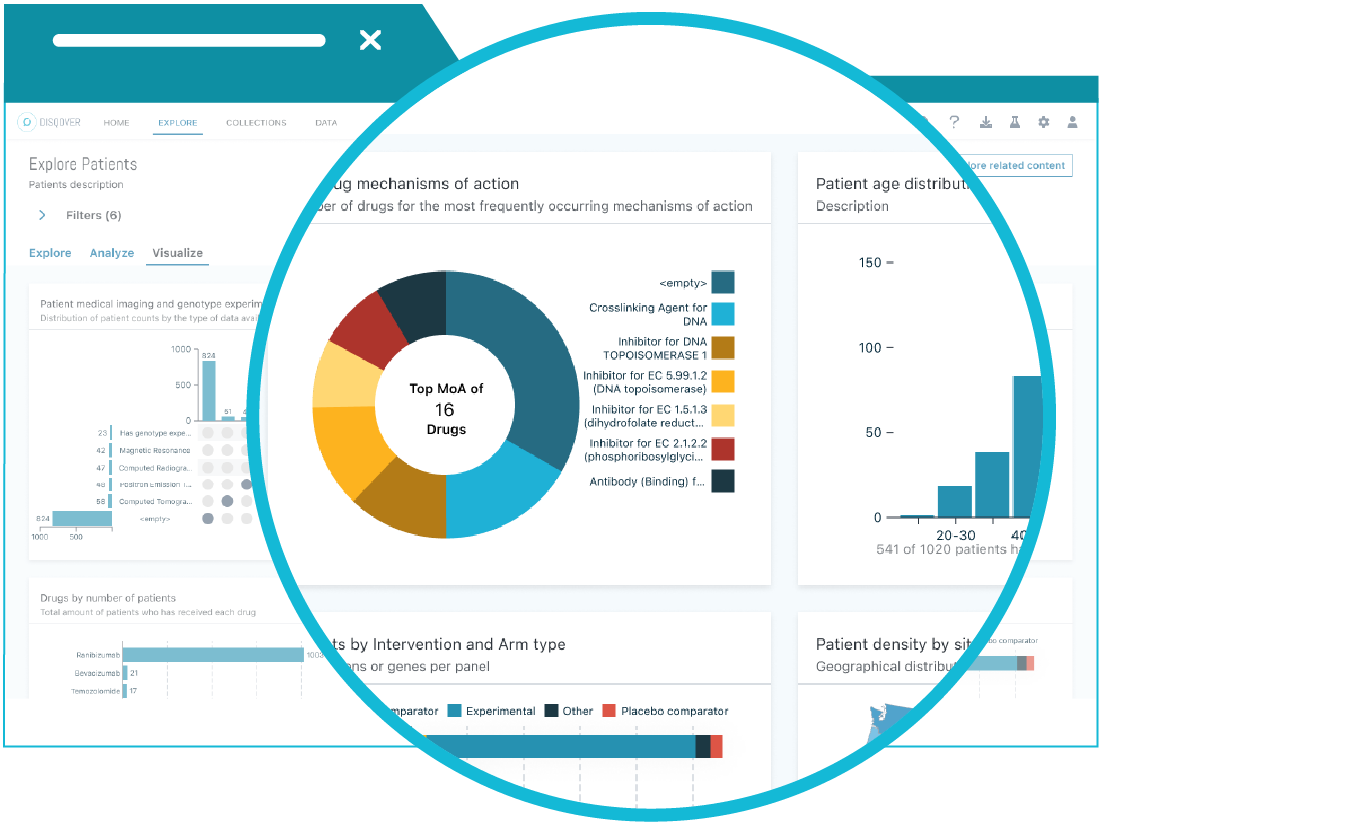
Create interactive visualizations with DISQOVER. Our platform provides powerful tools to build custom charts, graphs, tabular views and dashboards, helping you to present complex data in an understandable and actionable format.
DISQOVER’s powerful visualization is designed to transform graph data into clear, interactive visual representations for end users. It supports formats such as node-link diagrams, charts, and hierarchical trees, allowing users to zoom, filter, and focus on specific areas of interest.
By simplifying the complexity of relationships within the data, this tool empowers bench scientists and business users to uncover insights, spot anomalies, and make well-informed decisions with greater ease - all by themselves, without needing help of data scientists
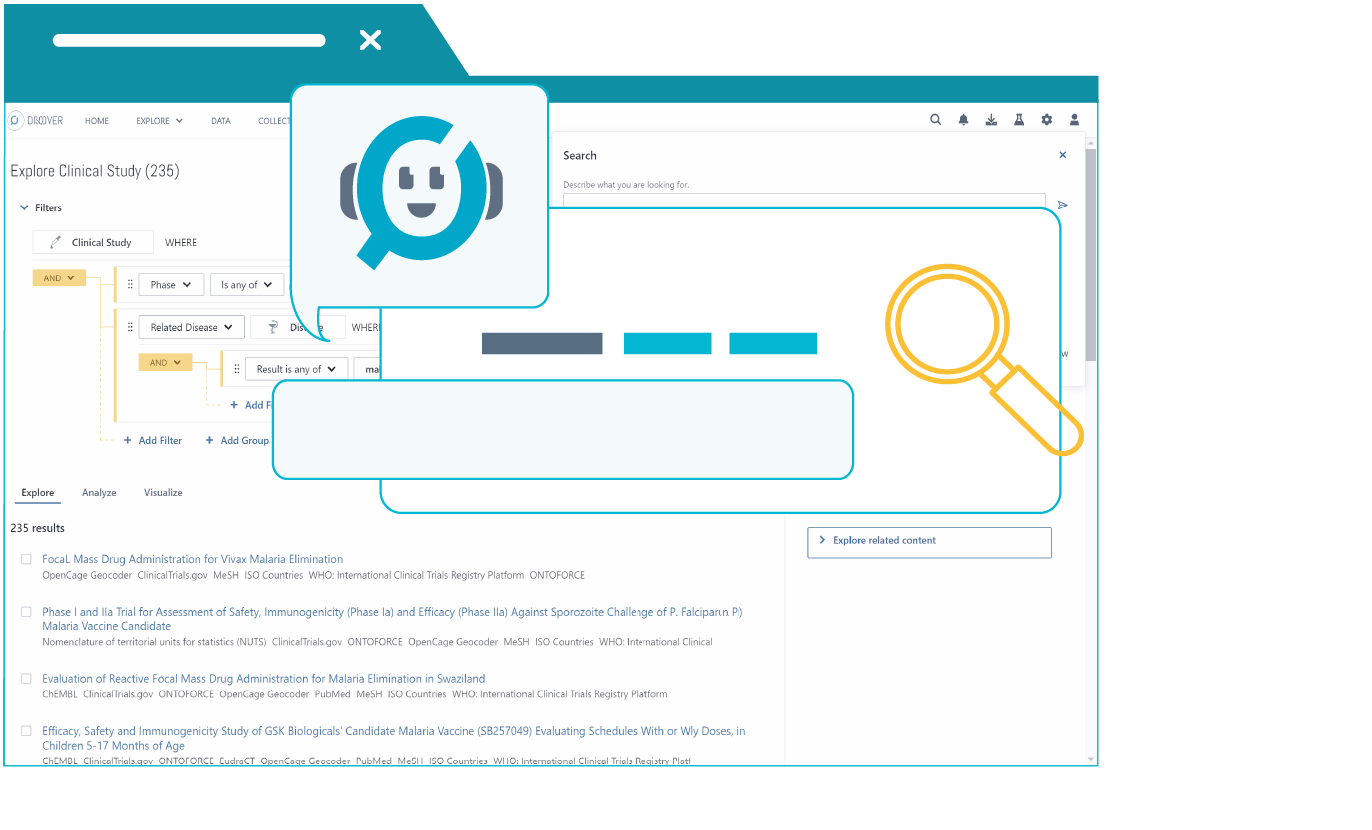
Take advantage of the DISQOVER Assistant, which utilizes large language models. Ask questions in plain English to assist in query formulation and to summarize search results, ensuring a more effective and confident user experience.
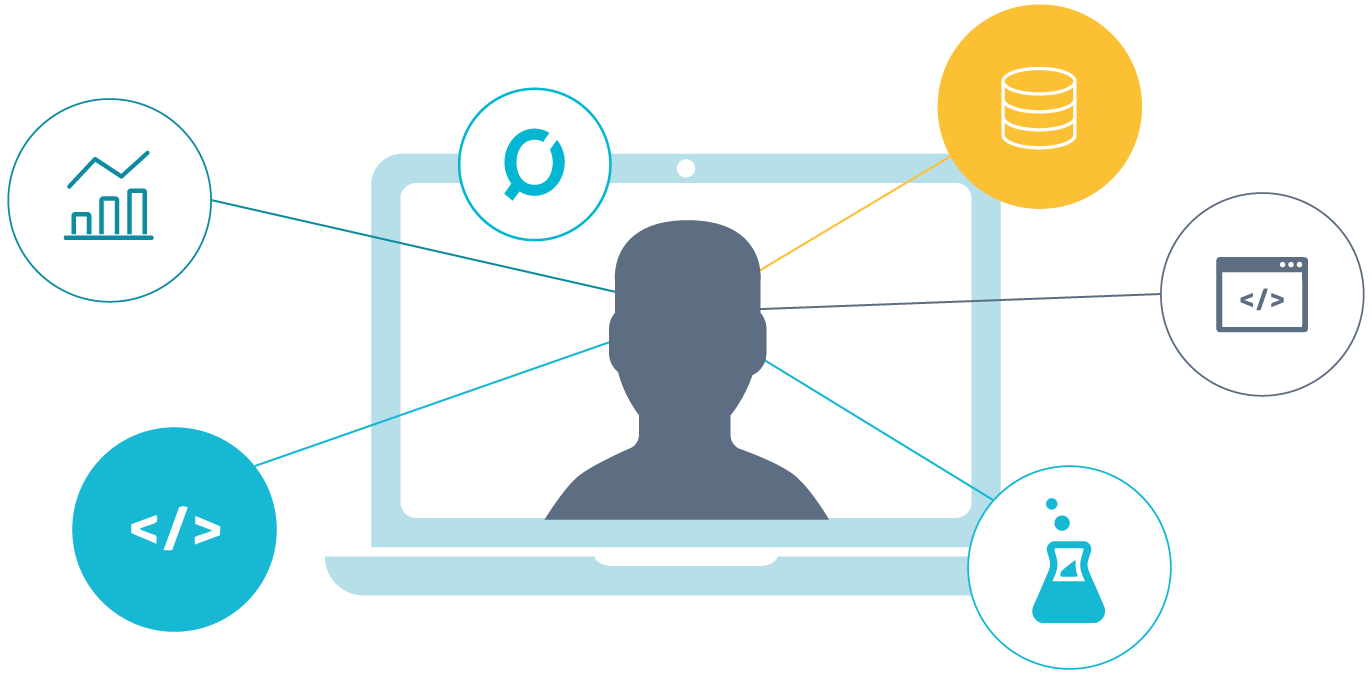
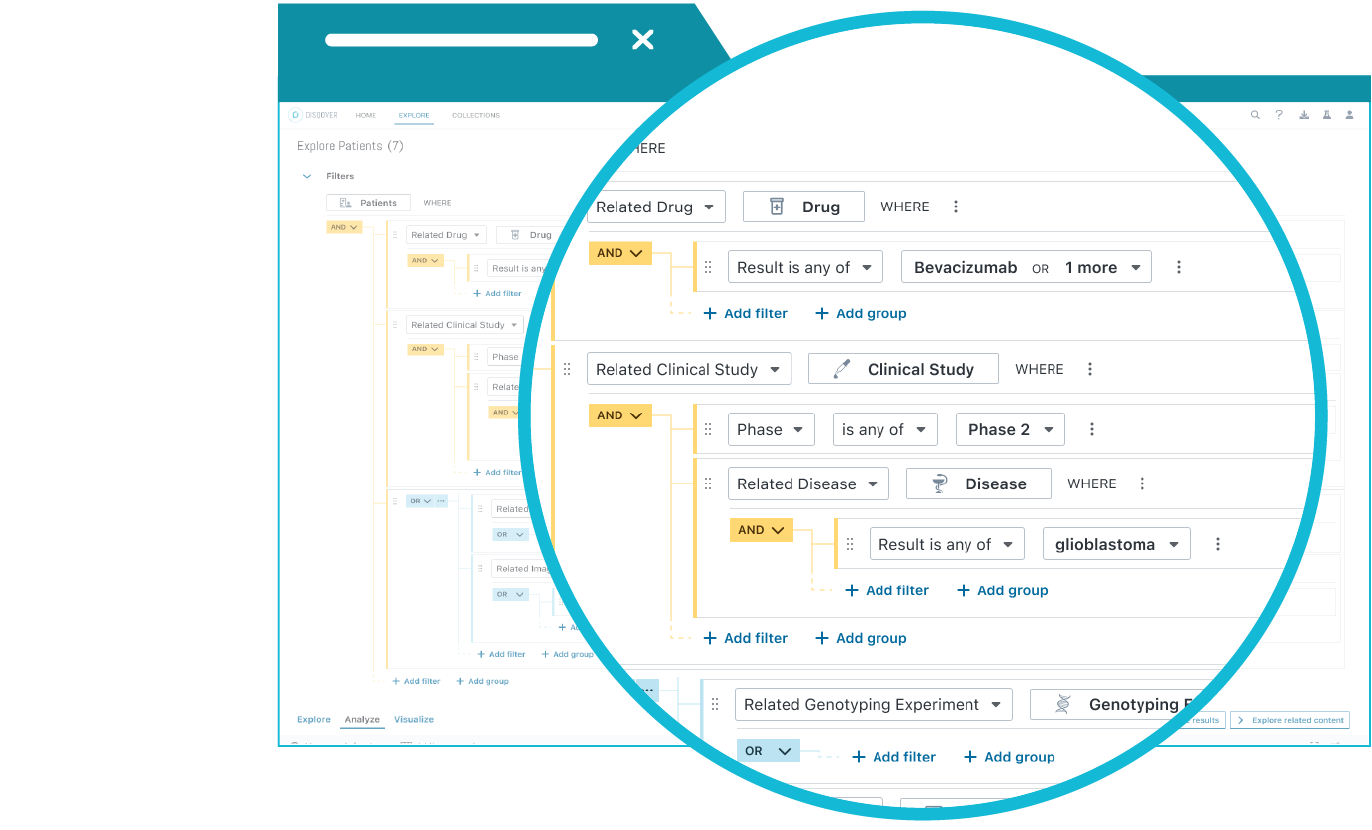
Empower users of all skill levels with DISQOVER’s intuitive user interface. Our platform makes data exploration straightforward and efficient for everyone from scientific researchers to data scientists and business managers, enabling all users to uncover insights whatever their technical expertise.
© 2026 ONTOFORCE All right reserved